Workloads
pgbench_ro
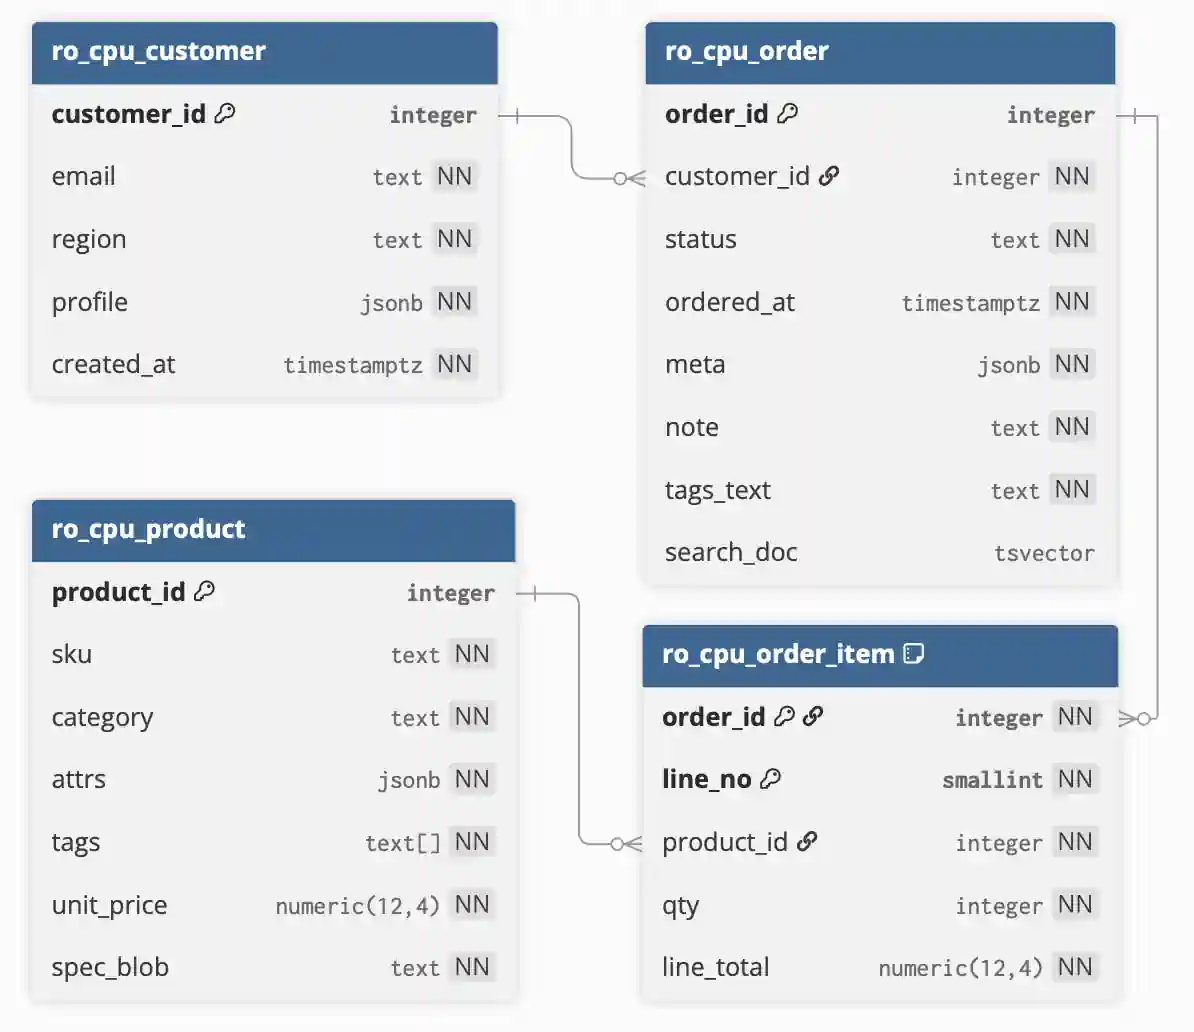
pgbench_ro is a custom read-only workload with one transaction composed of
eight query blocks. They exercise joins, aggregation, indexes, full-text search,
arrays, and other PostgreSQL subsystems to emphasize CPU work rather than disk
I/O (Input/Output). The setup script, ro_cpu_setup.sql,
creates the following test data, which takes about 303 MiB including indexes on
PostgreSQL 18:
- 20,000 products
- 50,000 customers
- 250,000 orders
- 750,000 order items
The harness invokes pgbench with -D scale=N and -f
ro_cpu_txn.sql. -D scale=N multiplies most block widths
inside the transaction (wider slices, bigger joins) without touching the
underlying dataset, so a single fixed schema can represent a range of CPU
intensities. Total work grows sub-linearly, because some blocks have fixed
costs.
The workload uses fixed concurrency points {1, V/2, V, 2·V}, set in
benchmark.py, where V is the database vCPU count,
instead of a geometric search. This choice came out of the
latency and pipelining experiments.
The transaction is intentionally a single SQL (Structured Query Language) statement whose eight blocks each touch a different PostgreSQL subsystem:
q_idx: B-tree index scan, nested loop, and window aggregateq_hashjoin: hash join and hash aggregate over a time sliceq_regex: regular expressions andmd5()q_fts: full-text search usingtsvectorand GIN (Generalized Inverted Index)q_array: array containment using GINq_stats: ordered-set and statistical aggregatesq_toast: TOAST (The Oversized-Attribute Storage Technique) fetch and decompressionq_seqscan: plain sequential scan and aggregate
The setup also creates a BRIN (Block Range
Index) on the
ro_cpu_order.ordered_at column; the planner may use it for the time-window
predicate.
At the end of each transaction, the script combines the eight block outputs with
UNION ALL and hashes them into one md5(string_agg(...)) checksum. The
checksum makes the result depend on the block outputs and prevents the planner
from optimizing away their work; it is not this benchmark's score. The harness
then converts pgbench throughput to TPM (Transactions Per Minute), the
published headline score.
pgbench_tpcb
This workload is pgbench's built-in tpcb-like script (-b tpcb-like) with a
standard pgbench -i -s N schema. It is a standard OLTP (Online Transaction
Processing) mix in the style of TPC-B (Transaction Processing Performance
Council Benchmark B): mostly write-heavy and
sensitive to disk, network, and locking. Because it is disk-limited, it is kept
for possible later use but not run in production.
The workload measures geometric anchors {1, V/4, V/2, V}, rounded to ladder
rungs, where V is the smaller of the database vCPU count and the scale factor;
client counts never exceed the scale factor. Its adaptive search adds points
above the highest anchor while throughput keeps improving. At the default scale
factor of 65, it adds points only when SC_PROFILE_MAX_CLIENTS is raised above
the highest anchor.
See the official documentation for details.